
SysOpsLab is dedicated to providing hands-on, practical tools for system, network, and security administrators. Our mission is to simplify IT operations, enhance security, and empower professionals to maintain reliable, secure, and high-performing infrastructure.
At the core of our platform is the SecOpsNet Suite, a unified console that combines system diagnostics, security baseline assessments, troubleshooting tools, and real-time health metrics – all in one interactive interface.
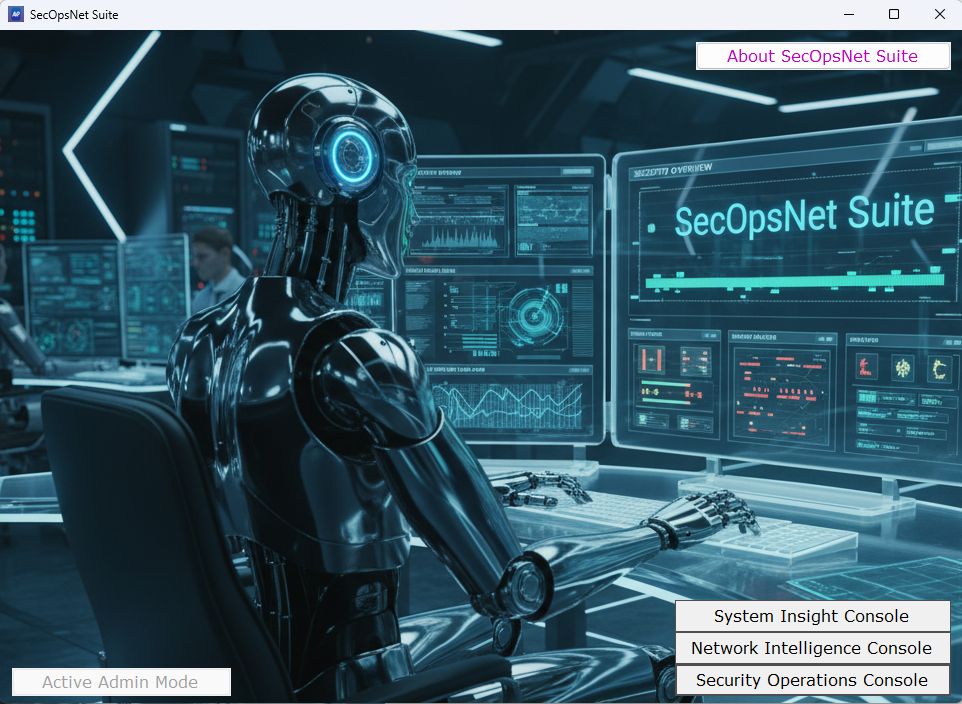
SYSTEM INSIGHT CONSOLE
The System Insight Console module provides a complete diagnostic snapshot of the computer, operating system, domain configuration, hardware, licensing, and network environment. It is designed for troubleshooting, auditing, and environmental verification.
System Information
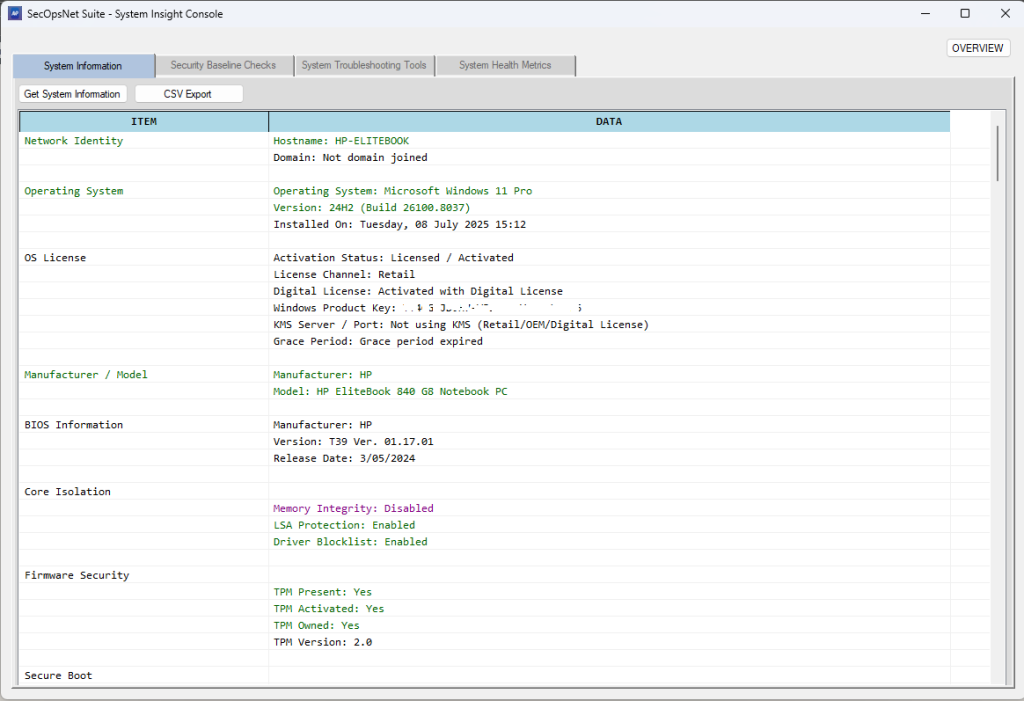
Key Capabilities:
- Operating system and Windows activation status
- Hostname, domain, and Active Directory site details
- BitLocker, TPM, and firmware security status
- Hardware inventory: CPU, RAM, motherboard, storage, GPU
- Network adapter configuration, IP addresses, MAC addresses
- Local accounts, last restart time, and pending reboot detection
- Installed software inventory and update history
Purpose: Provides a complete technical profile for diagnostics, compliance checks, and environment verification.
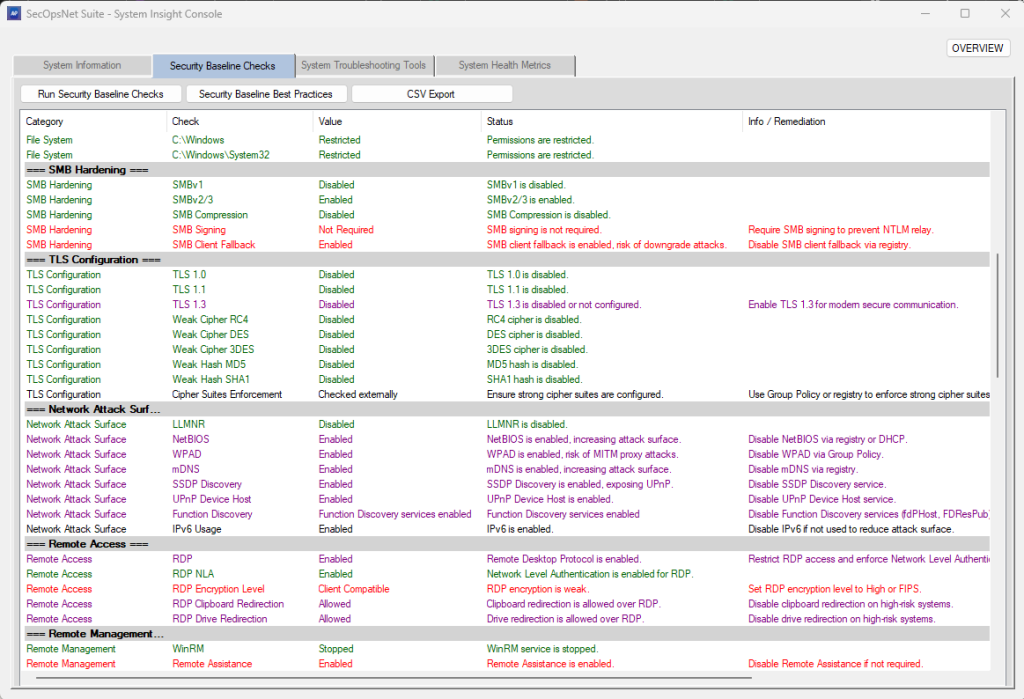
Security Baseline Checks
Our security module evaluates systems against modern Windows security, cryptography, protocols, and lifecycle standards. It highlights misconfigurations and high-risk settings commonly exploited in real-world attacks.
Areas Assessed:
- OS lifecycle & support
- Platform security & TPM readiness
- Disk encryption (BitLocker)
- Endpoint protection (Microsoft Defender)
- System integrity (VBS, HVCI, Credential Guard)
- Firewall & network rule integrity
- User Account Control (UAC) enforcement
- Network shares, file system permissions, SMB hardening
- TLS, cryptography, and network attack surface
- Remote access & management hardening
- Time synchronization and authentication policies
- Legacy or high-risk services
- Printing and removable media security
- Startup & autorun persistence
- Local administrator accounts and open TCP ports
- Windows update, browser, .NET runtime, and software lifecycle
- Certificate store integrity
Purpose: Provides color-coded security readiness assessments for compliance, vulnerability reduction, and enterprise hardening baselines.
System Troubleshooting Tools
SysOpsNet Suite automates common repair actions and diagnostics, helping IT professionals quickly resolve operational issues:
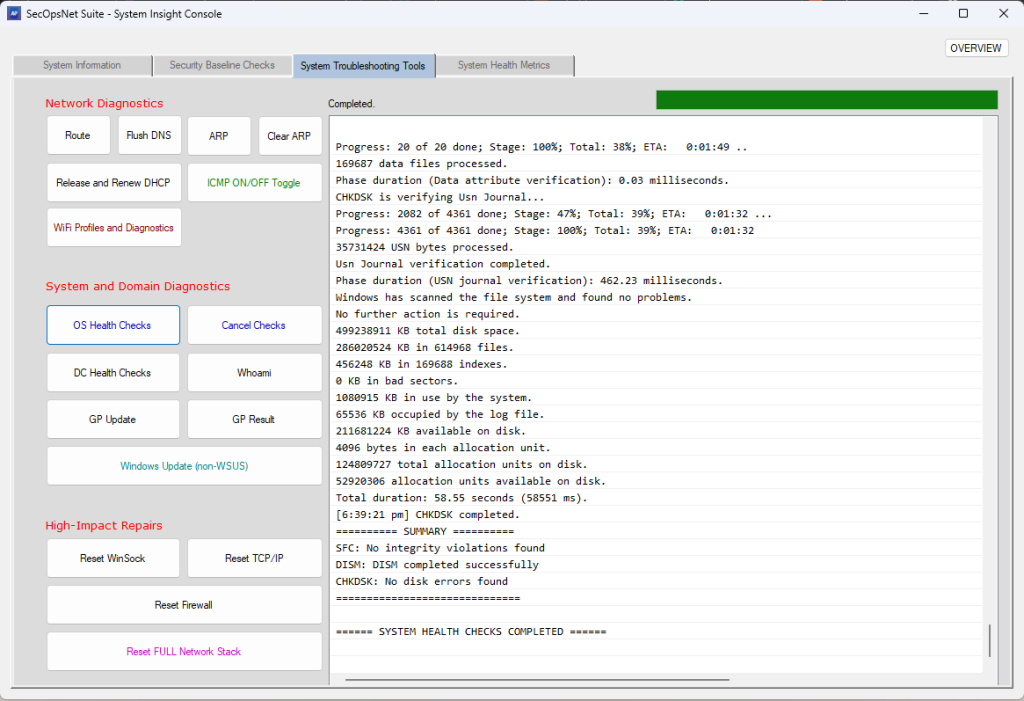
- System health checks for OS integrity, updates, and security features
- Domain controller health checks, Kerberos ticket validation, DNS tests
- Network repair tools: Winsock, TCP/IP, firewall reset, flush DNS
- ICMP mode toggle for diagnostic testing
Purpose: Provides fast, guided troubleshooting for connectivity, domain, and operating system issues.
System Health Metrics
Our metrics module gives a real-time, categorized view of system stability, performance, and operational health, consolidating hardware, software, and network signals into a single interactive console.
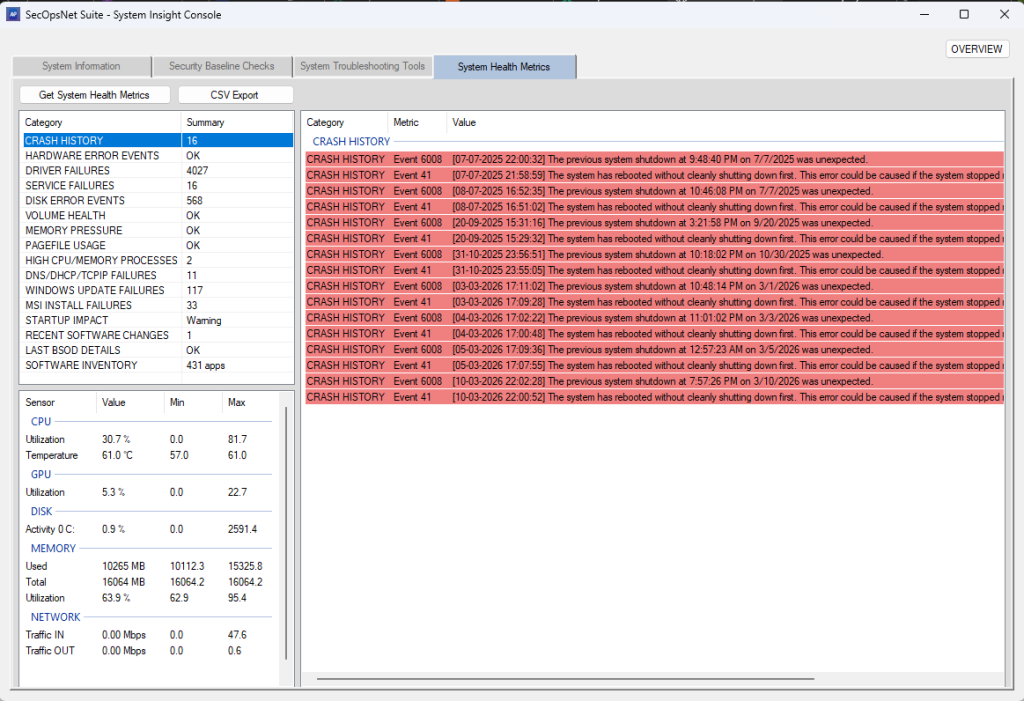
Metrics Include:
- CPU, memory, GPU, disk, and network utilization
- Crash history, driver/service failures, pagefile usage
- Startup impact, software changes, and BSOD tracking
- Live telemetry with color-coded alerts for high load, overheating, or bottlenecks
Purpose: Enables technicians to quickly identify resource saturation, memory pressure, or network spikes and take corrective action efficiently.
NETWORK INTELLIGENCE CONSOLE
The Network Intelligence Console module provides a comprehensive suite of diagnostic, monitoring, scanning, and analysis utilities designed for network engineers, security analysts, administrators, and troubleshooting workflows. It centralizes deep inspection tools into a single interface for visibility, auditing, and investigation.
IP Information
- Detects LAN (local) and WAN (public) IP addresses
- Performs geolocation lookup (country, region, ISP)
Process Monitor
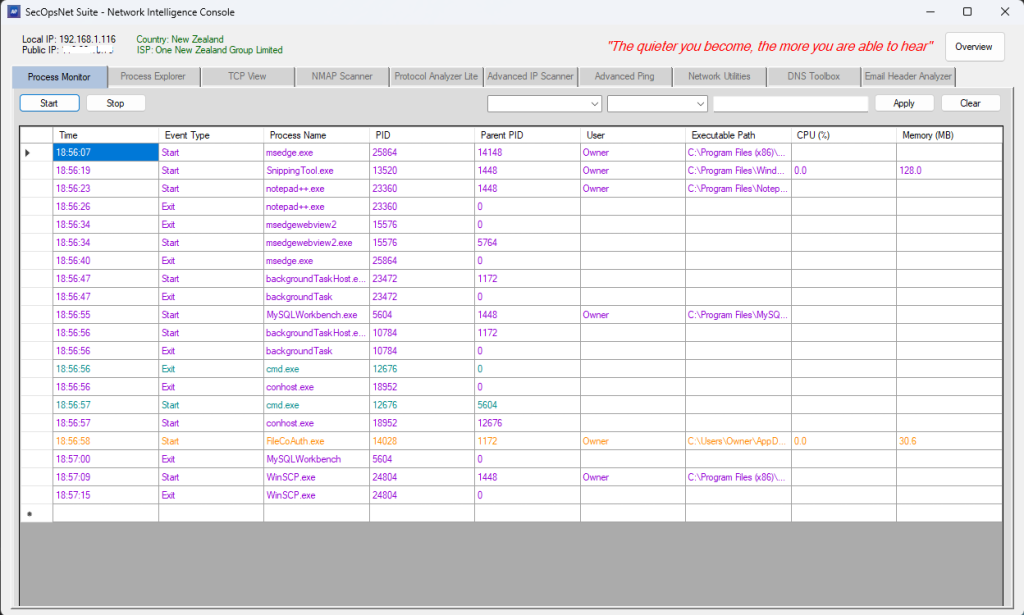
- Real‑time list of running processes with CPU, memory, threads, handles
- Highlights suspicious or abnormal processes
Process Explorer
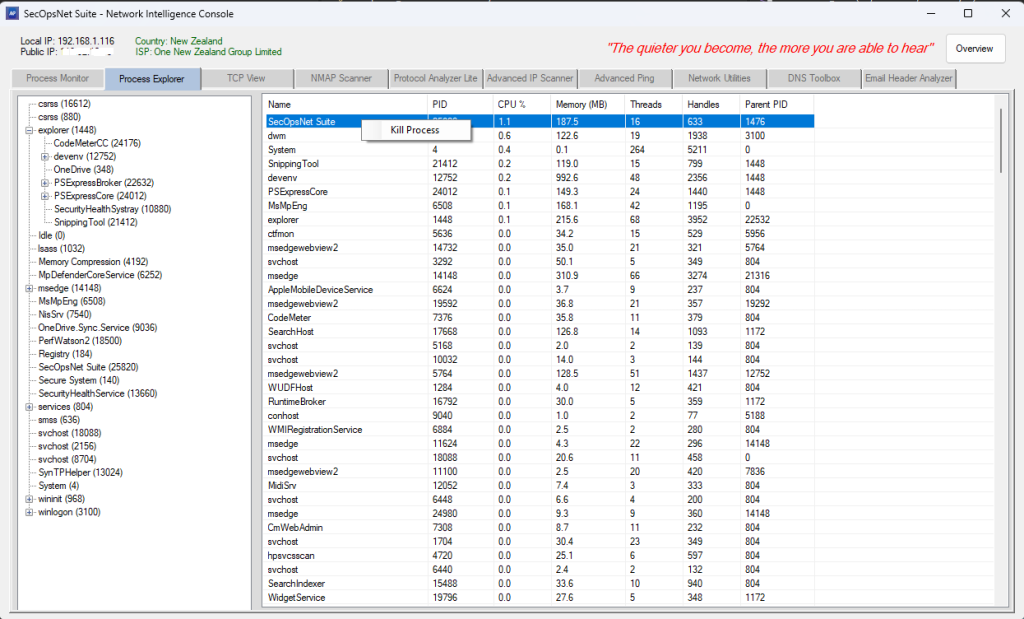
- Deep inspection of selected processes (modules, handles, threads, environment)
- Supports opening file locations and terminating processes
TCP View
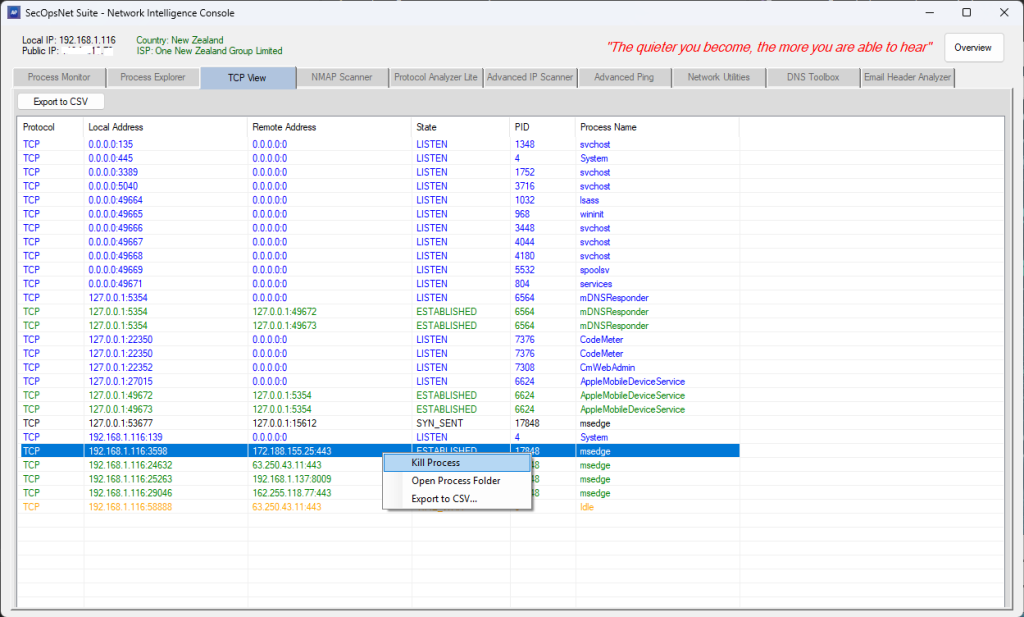
- Displays all active TCP and UDP connections
- Shows local/remote IP, port, protocol, and connection state
- Includes DNS resolution and filtering
NMAP Scanner
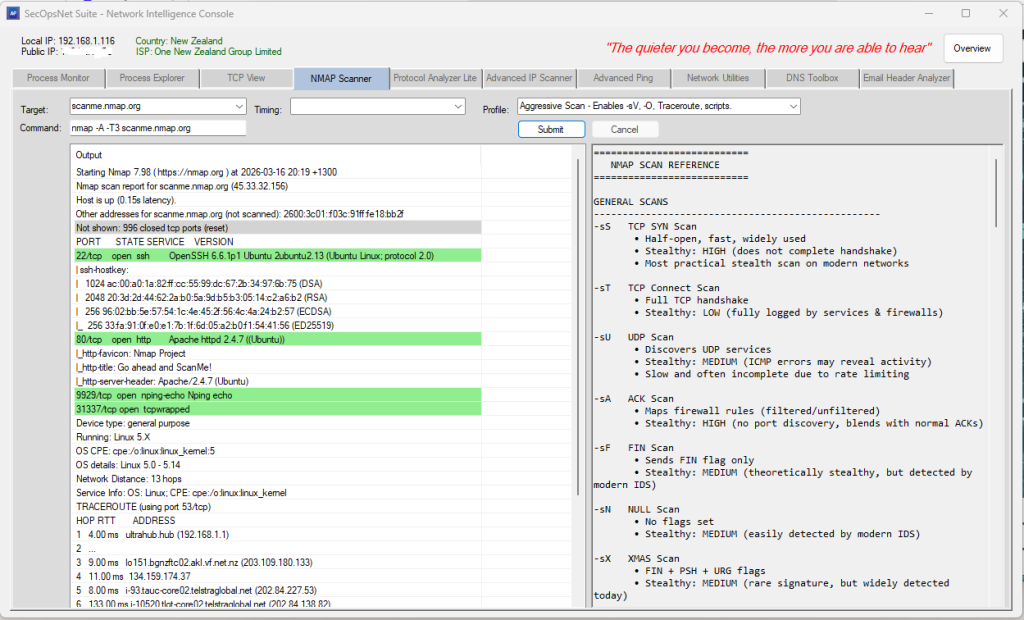
- Runs Nmap scans directly from the application
- Supports SYN, Connect, UDP, ACK, FIN, NULL, XMAS, Version Detection,
OS Detection, Aggressive, Fast Scan, Ping Scan, List Scan, and more - Includes advanced profiles such as Intense Scan and Regular Scan
- Supports timing templates T0–T5 for speed vs. stealth
- Displays the exact Nmap command before execution
- Color‑coded output for open, filtered, and closed ports
- Supports scan cancellation and real‑time output streaming
Protocol Analyzer Lite
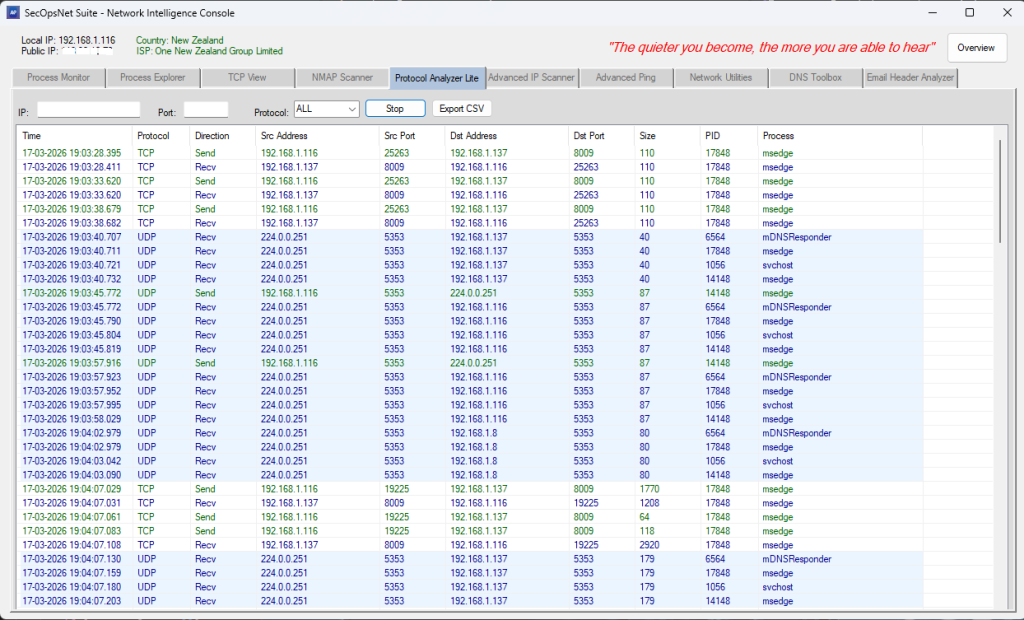
- Real‑time packet‑level monitoring using ETW
- Shows timestamp, direction, source/destination IP and port, size, PID, process
Advanced IP Scanner
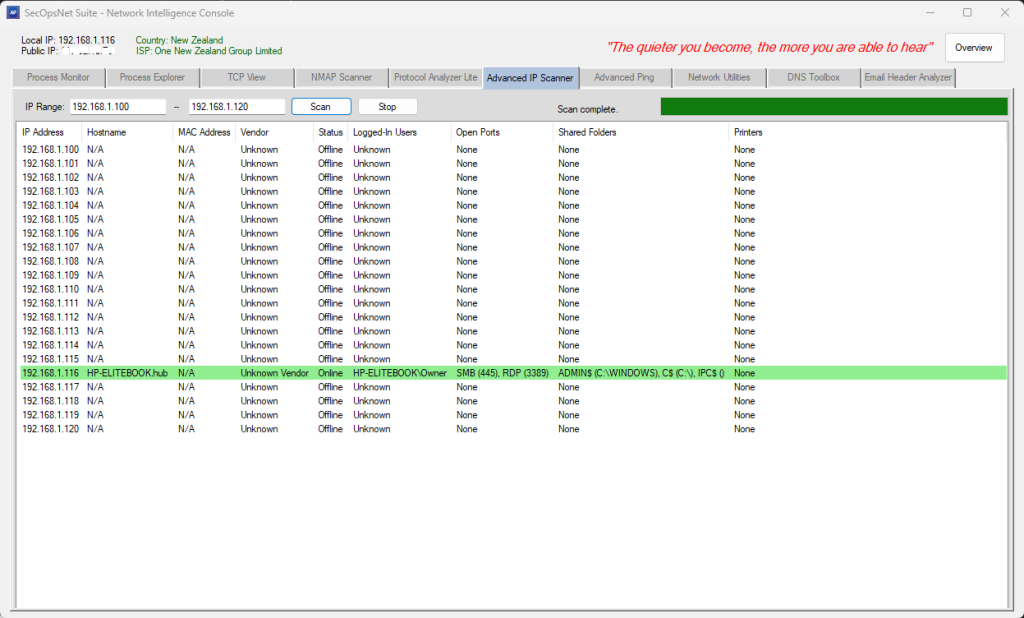
- Scans an IP range for online devices
- Detects hostname, MAC address, and vendor
- Identifies open standard ports (HTTP, HTTPS, SMB, RDP, SSH, etc.)
- Enumerates shared folders and printers
- Retrieves active logged‑in users (console + RDP)
- Highlights online hosts with detailed per‑device information
Advanced Ping
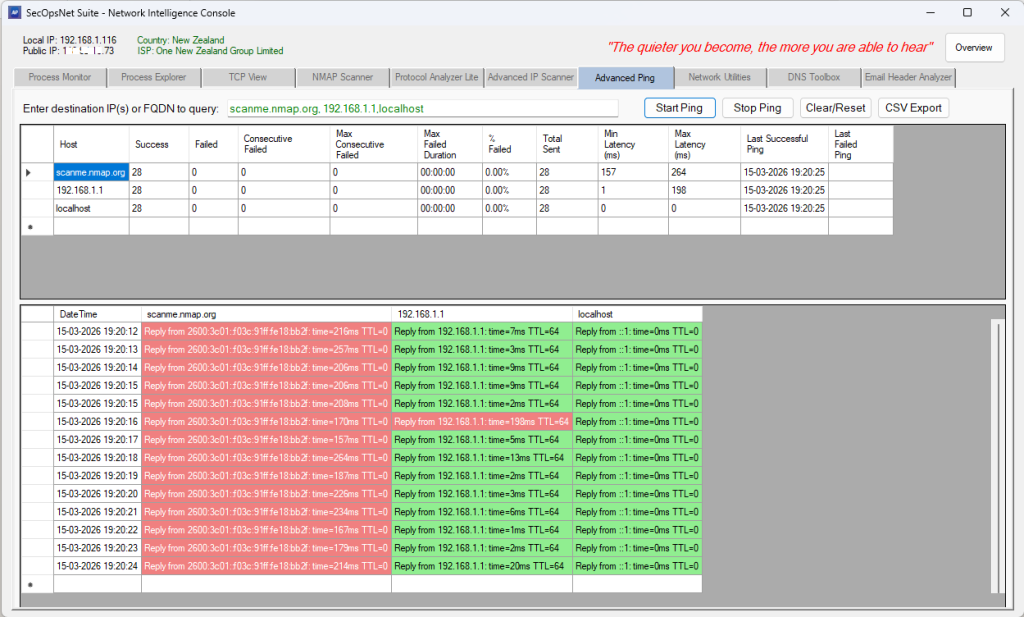
- High‑precision ICMP ping engine with per‑host analytics
- Tracks latency, jitter, packet loss, and uptime in real time
- Supports multiple hosts simultaneously
- Intelligent backoff for unreachable hosts
- Color‑coded latency ranges for clarity
- Displays last response, average latency, best/worst times, failure streaks
DNS Toolbox
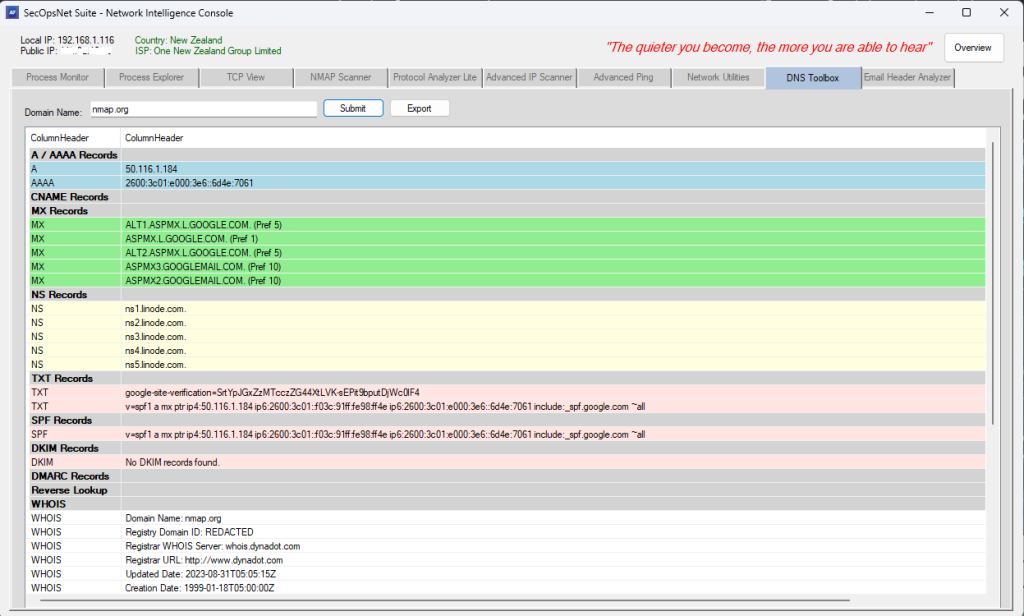
- Performs full DNS record inspection (A, AAAA, MX, NS, TXT, SPF, DKIM, DMARC)
- Supports reverse DNS (PTR) and WHOIS lookups
- Structured, color‑coded ListView output
Network Utilities
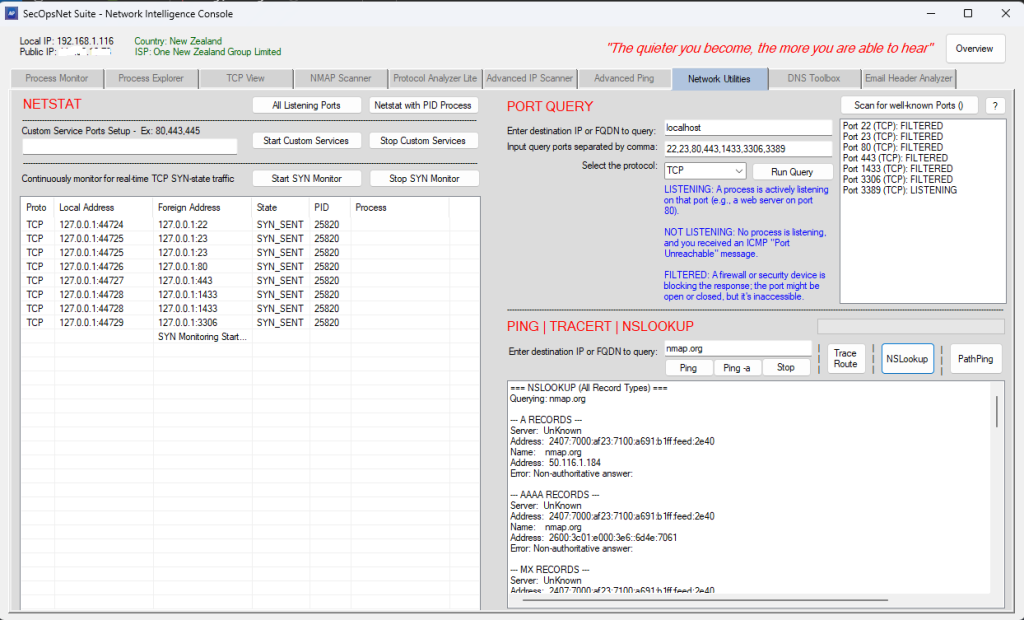
- Unified interface combining Ping, Traceroute, PathPing, NSLookup, Netstat,
and Port Query - Start a TCP listener on custom port(s) for diagnostics
- Start SYN‑state monitoring to identify connection attempts and potential network anomalies.
- Real‑time reachability tests with latency, jitter, packet loss
- Hop‑by‑hop routing path mapping with timing analysis
- Full DNS record queries via NSLookup
- Enumerates active TCP/UDP connections
- Performs TCP port availability checks
Email Header Analyzer
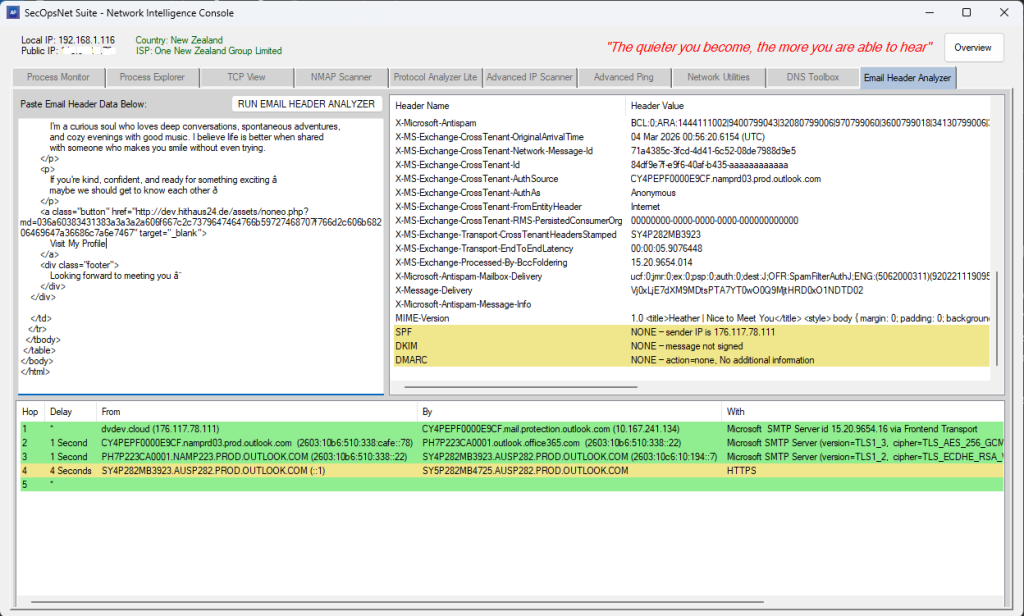
- Parses full email headers to reveal hop‑by‑hop routing paths
- Extracts Received chain with From/By/With/Time fields
- Computes hop delays with color‑coded performance indicators
- Decodes Base64 and Quoted‑Printable headers
- Summarizes all header fields in a structured ListView
- Performs SPF, DKIM, and DMARC validation
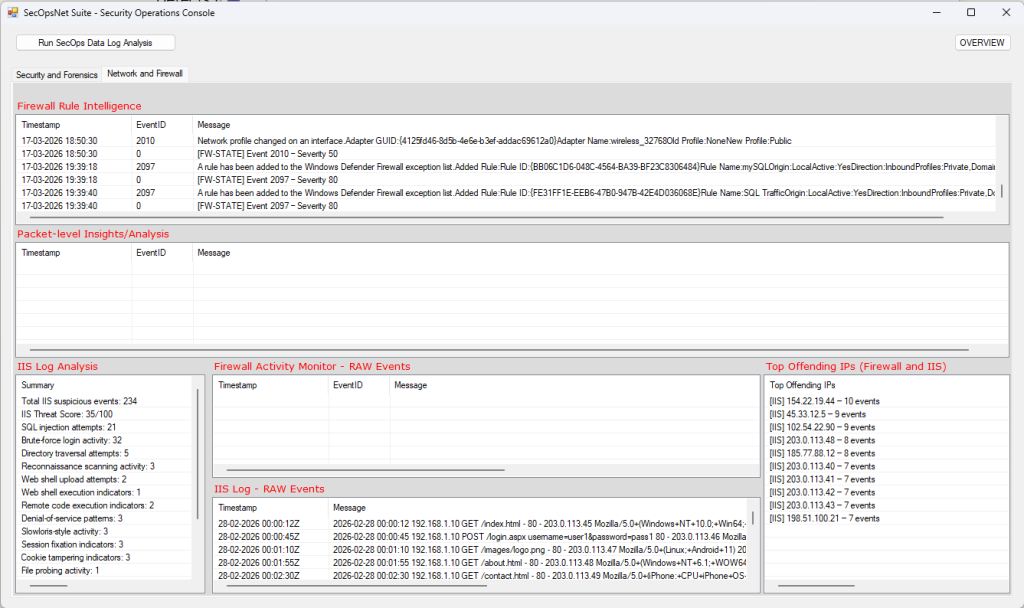
SECURITY OPERATIONS CONSOLE
Security Operations Console provides a unified, multi‑layered security and
network visibility platform. It correlates behavioral signals, forensic events,
network telemetry, firewall intelligence, IIS anomalies, and weighted threat
scoring into a single operational interface designed for analysts, responders,
and administrators.
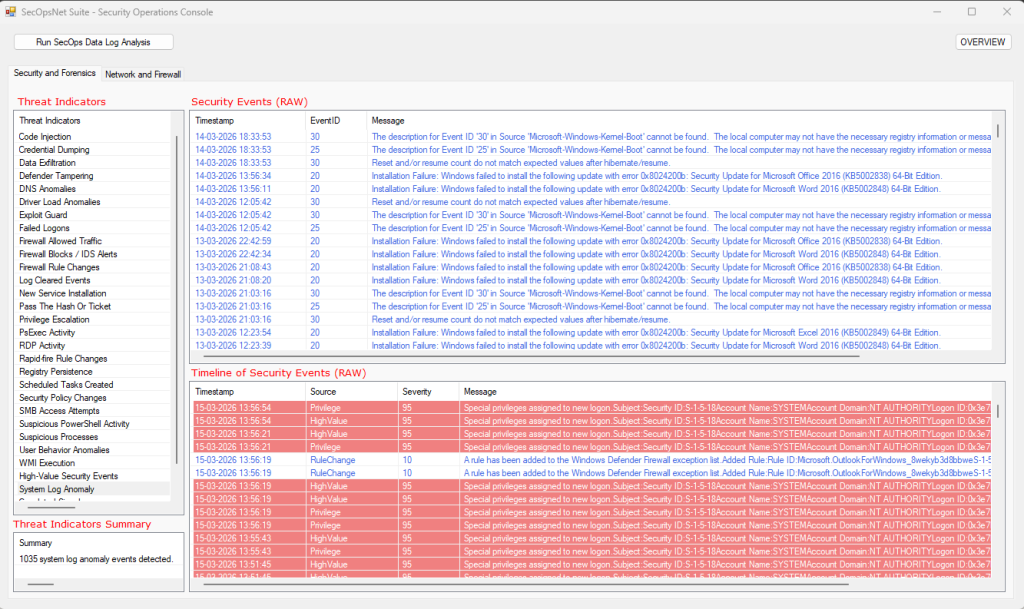
Security & Forensics
- Suspicious Process Analysis
Flags LOLBins (PowerShell, cmd, mshta, rundll32, etc.).
Detects processes running from user‑writable directories
(AppData, Temp, Downloads, Public, Recycle Bin).
Skips trusted Microsoft and Program Files processes to reduce noise. - Failed Logon Detection
Identifies brute‑force attempts, password spraying, and credential misuse. - Firewall Rule Change Monitoring
Detects firewall rule additions, deletions, and modifications (4946–4948).
Detects IPsec rule changes (4950–4952).
Flags PowerShell‑driven rule manipulation (2033).
Monitors firewall settings, profile changes, and policy enforcement
(2003–2006, 2009, 2010, 2099, 5037).
Detects firewall driver state changes (5034, 5035).
Detects firewall service start/stop and configuration changes (5025, 5032, 5033).
Identifies audit policy changes, privilege modifications, and log clearing
(4719, 4704, 4705, 4739, 1102, 104). - Rapid‑Fire Rule Change Detection
Flags bursts of rule or policy changes within short time windows. - High‑Value Security Events
Detects privilege escalation attempts, group membership changes,
scheduled task modifications, and Defender alerts. - System Log Anomalies
Identifies DNS failures, TCP/IP stack failures, port exhaustion,
DHCP conflicts, crashes, disk warnings, driver issues,
and unexpected shutdowns. - Correlation Engine
Links events across categories (e.g., suspicious process near firewall block). - Unified RAW Findings
Aggregates all forensic events into a single dataset for deep analysis. - Forensic Timeline
Chronologically reconstructs all events with severity scoring.
Network & Firewall
- Firewall Activity Monitoring
Tracks inbound/outbound blocks and allowed connections (WFP 5152–5159).
Detects firewall exception list changes and rule modifications (5154, 5447).
Identifies application blocks and filtering platform enforcement (5031).
Detects firewall driver and policy tampering (5034, 5035, 5037).
Detects repeated blocked attempts and high‑volume traffic bursts.
Extracts remote IPs, ports, and originating processes from firewall events. - Network Diagnostics
Monitors DNS resolution failures (1014).
Tracks adapter connect/disconnect and IP changes (27, 32, 4200–4204).
Detects TCP/IP stack failures and connection instability (4199).
Identifies port exhaustion and allocation failures (4227, 4231).
Flags DHCP errors and address conflicts (10400, 10401).
Highlights kernel‑level network and driver‑related failures. - Packet‑Level Insights
Analyzes Windows Filtering Platform packet events.
Detects high‑frequency packet bursts from single IP addresses.
Detects vertical port scanning (single IP targeting many ports).
Detects horizontal port scanning (multiple IPs targeting the same port).
Flags heavy activity on sensitive ports (22, 23, 80, 443, 445, 3389).
Highlights processes generating unusually high traffic volumes.
Detects potential beaconing behavior via periodic callback intervals.
Correlates IP frequency, port targeting, and process behavior patterns. - Top Offending IPs (Risk‑Based Ranking)
Separately identifies top firewall offenders and top IIS offenders.
Ranks remote IPs using severity‑weighted scoring (not frequency alone).
Applies recency‑based time weighting to prioritize active threats.
Boosts scoring for blocked events and sensitive port targeting.
Tracks last‑seen timestamps for real‑time threat visibility. - Firewall Rule Intelligence
Detects firewall rule additions, deletions, and modifications (4946–4948).
Detects IPsec rule manipulation (4950–4952).
Flags PowerShell‑driven rule changes (2033).
Monitors firewall policy and enforcement changes (2003–2006, 2009, 2010, 2099, 5037).
Detects firewall service and configuration changes (5025, 5032, 5033).
Identifies audit policy changes and security log clearing (4719, 1102, 104).
Highlights bursts of rule changes within short time windows.
Detects potential tampering or defensive evasion activity.
Performs rule impact analysis to flag newly opened sensitive ports. - IIS Log Analysis
Parses full IIS W3C logs including timestamp, IP, method, URI, and status.
Detects SQL injection, directory traversal, remote code execution,
web shell upload and execution, and application abuse.
Identifies brute‑force, fast brute‑force, and distributed brute‑force attacks.
Flags reconnaissance scanning, botnet scanning, and file probing.
Detects sensitive file access and debug endpoint exposure.
Detects session fixation, cookie tampering, TLS downgrade attempts,
denial‑of‑service patterns, and Slowloris‑style activity.
Separates suspicious vs normal traffic with priority‑based categorization.
Provides full RAW IIS anomaly visibility.
Generates IIS Top Offending IPs independently from firewall telemetry.
Computes an IIS Threat Score based on severity weighting.